Introduction
With the proliferation of social media around the globe, it has become incredibly easy to propagate information around. A recent survey by Statista claims that more than 75% of users spend more than 30 minutes everyday on different social media platforms. Another Pew survey shows that around 62% people in USA get their daily news and updates from social media. This gives City Police Departments a very effective medium to interact with users in their cities.
This potential has not gone unnoticed. A survey by Berkley showed that 96% of Police Departments have started using social media to spread information and solving crimes. However, some handles are much more competent in exploiting social media to their benefit. In this post, we will try to analyse what these handles post, what reaction they receive and how they can improve.
The Burning Questions
- What are these Police handles posting?
- How frequent are they posting?
- What types of posts attract the most attention?
- What is the general trend and sentiment of posting?
- Are these handles interacting with the public well?
- Are real world problems being solved by these handles?
- Which handles outrank the others in different categories?
- How these trends change corresponding to real world events?
Methodology
We analysed 8 police handles - 3 from India, 3 from the USA and 2 from the UK. The following analysis was done on each of them.
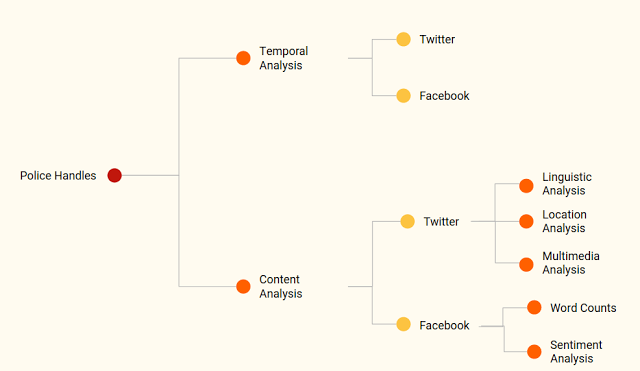
On the basis of the above, we constructed a metric to compare the community engagement of these handles. Finally, we propose ways by which a handle can improve its engagement with its audience.
Temporal Analysis
Tweets and Facebook posts made by each of the police handles were collected for a long period of time. Due to API restrictions of Twitter, data collected was between 1st August, 2017 to 7th November, 2017. The data for Facebook was collected for a longer period of time.
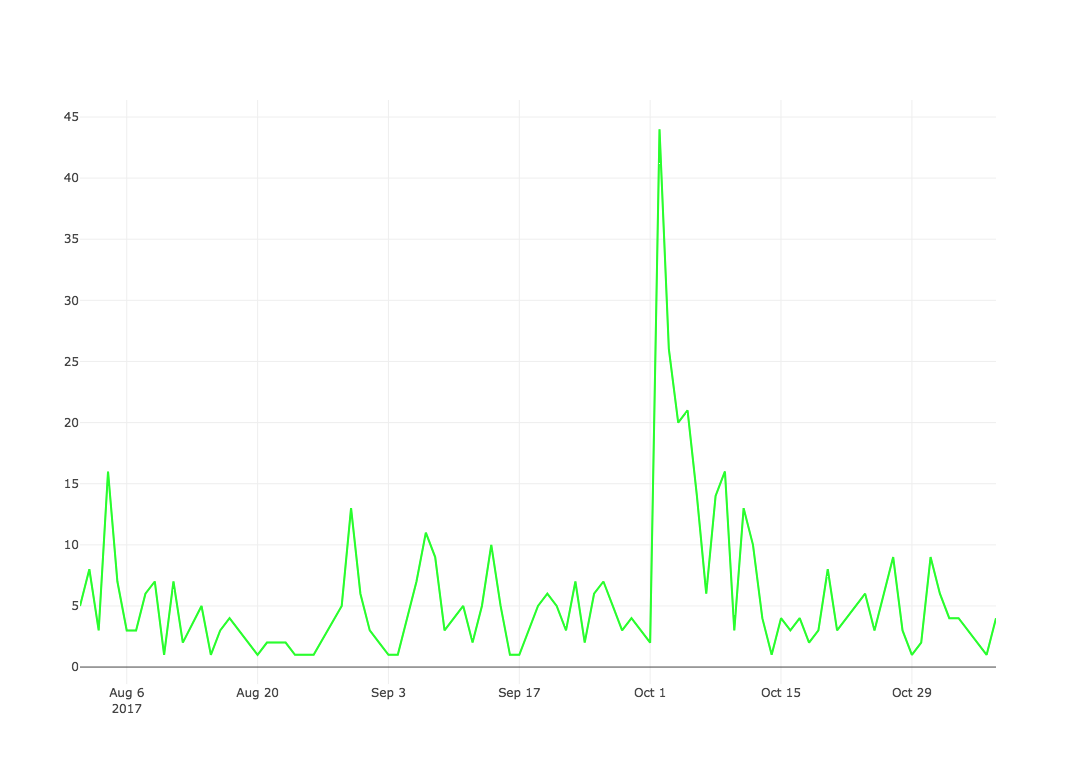
The inferences obtained from Facebook are a lot more interesting. Let us look at one of them.
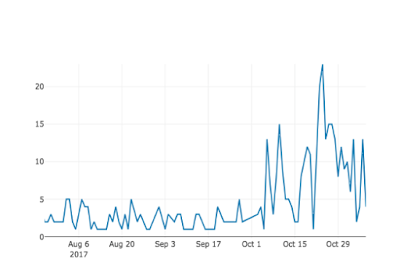
In this graph a peak can be observed on October 26th. Turns out a massive fire broke out that day.
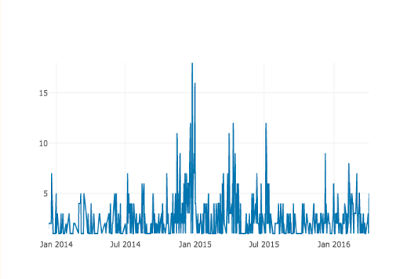
Once again a massive peak can be seen around the end of 2014. Turns out a series of bomb blasts occurred.
The trend tells us that the frequency of posting increases around major real world events. Similarly on Twitter:
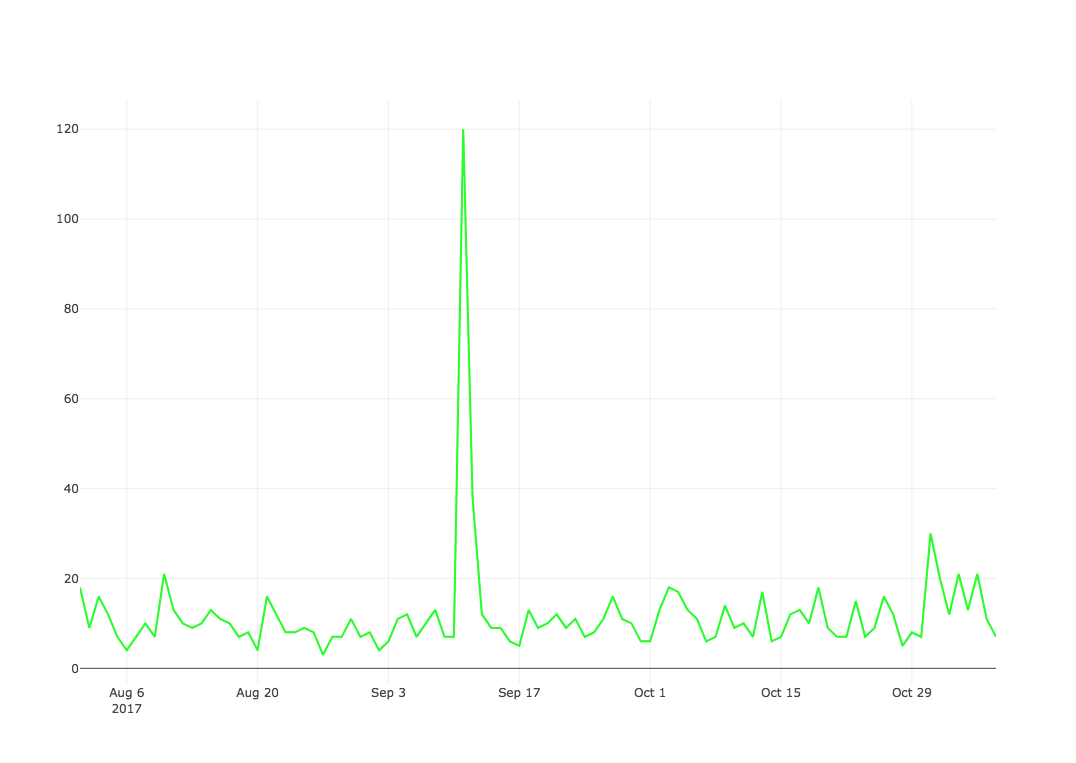
The 9/11 memorial day in New York Shooting in Las Vegas
Content Analysis
Word Counts and Clouds
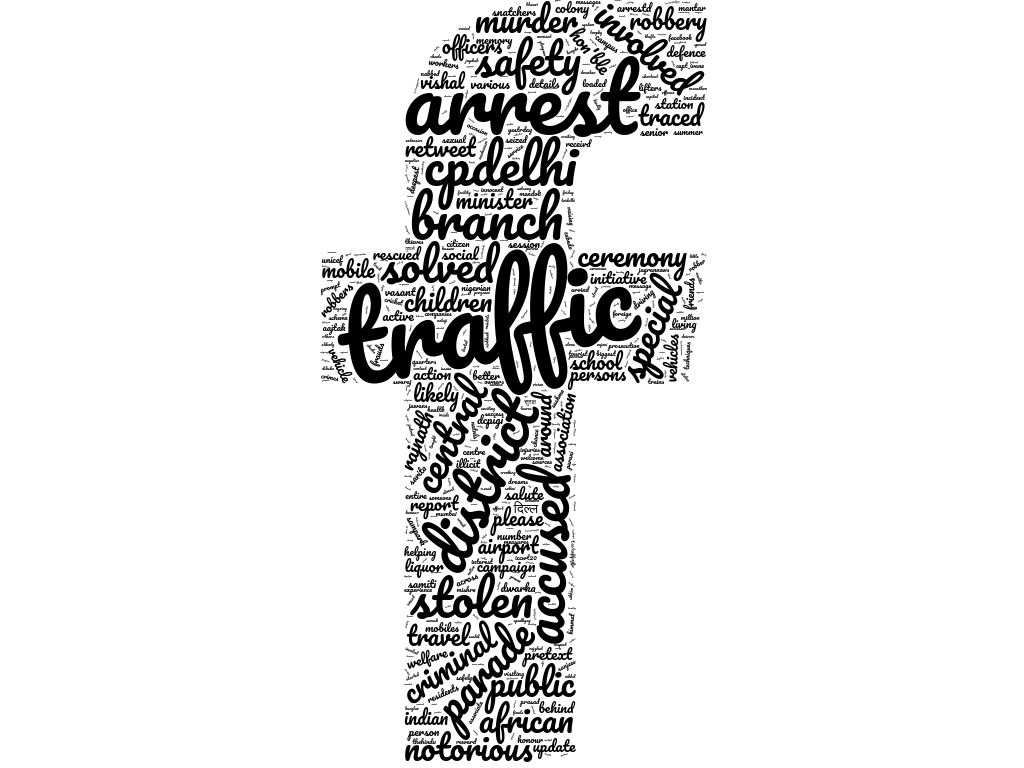
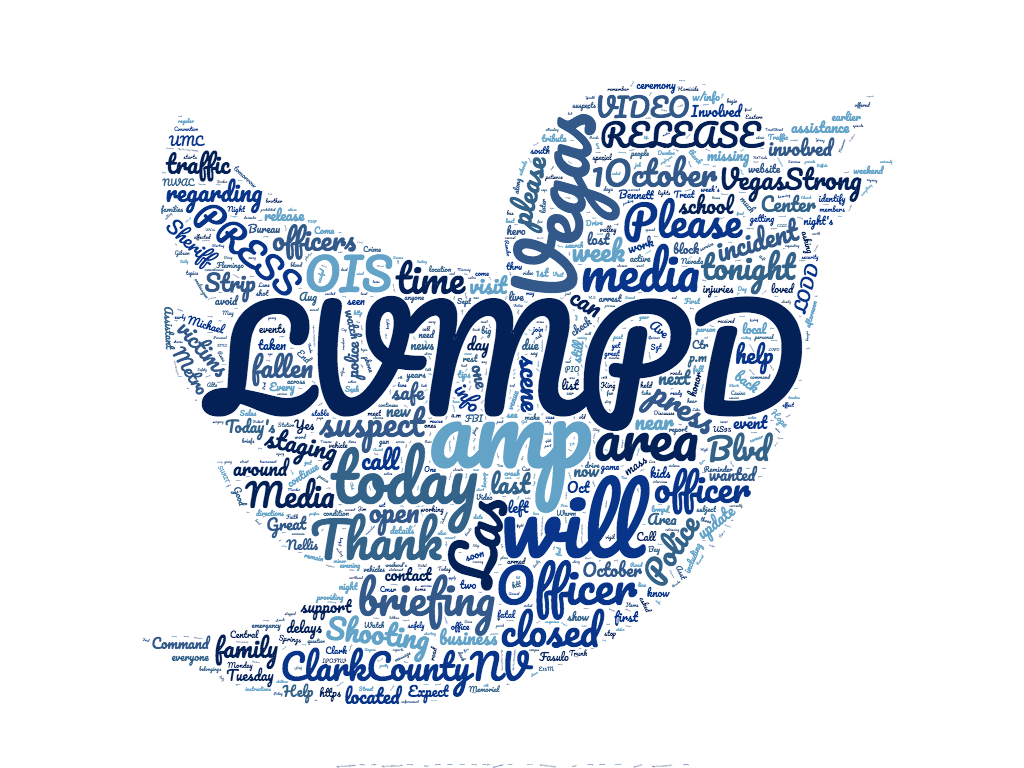
These macro measures give us a very crude understanding of the issues these handles deal with, We collected all the text in tweets and posts constructed word clouds for all of them. The following show the results for a few of them (Delhi, LA, LV, NYC).
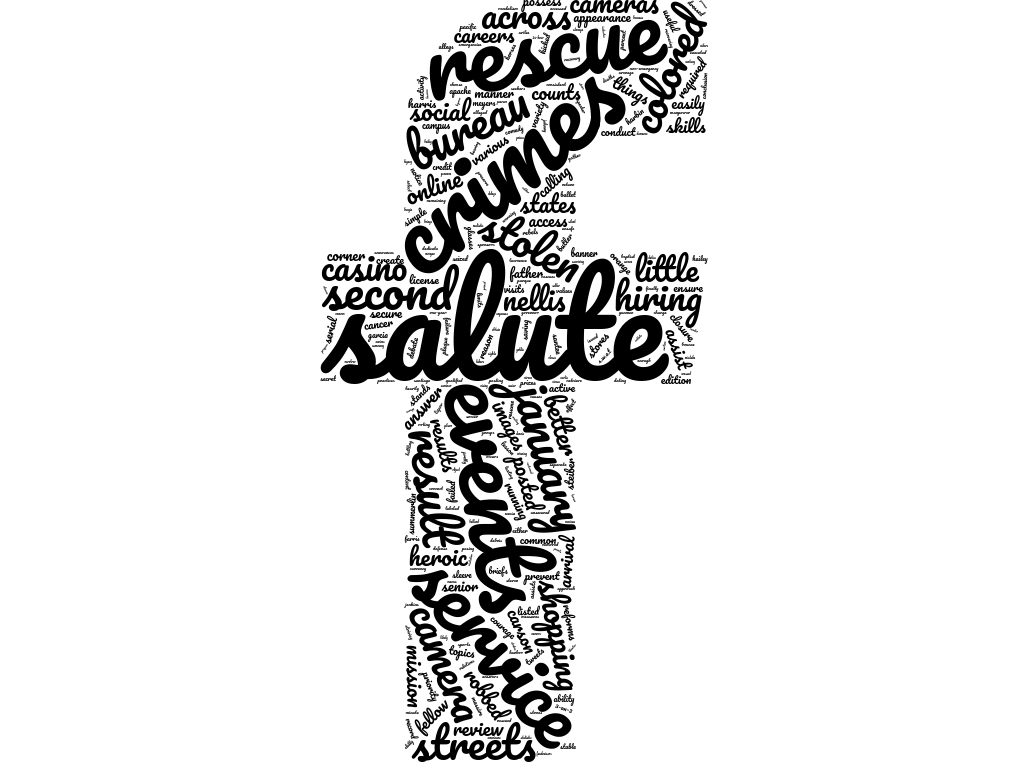

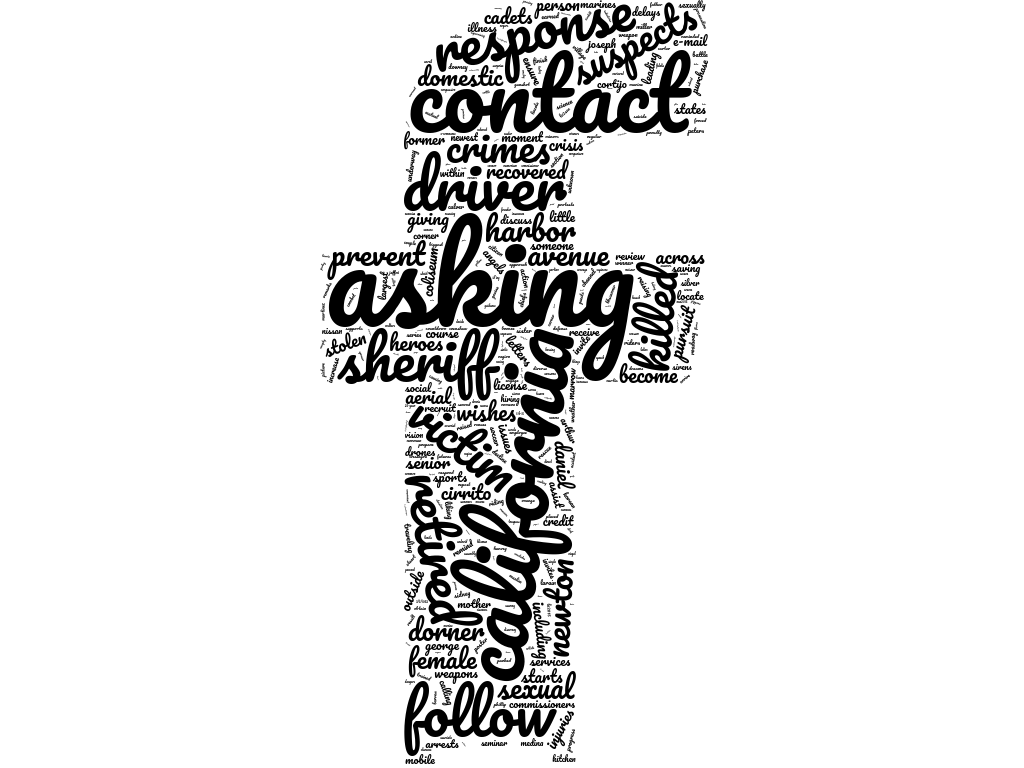
Similarly for Twitter - observing for NYC and LV, we see most of what they post are community goodwill tweets.
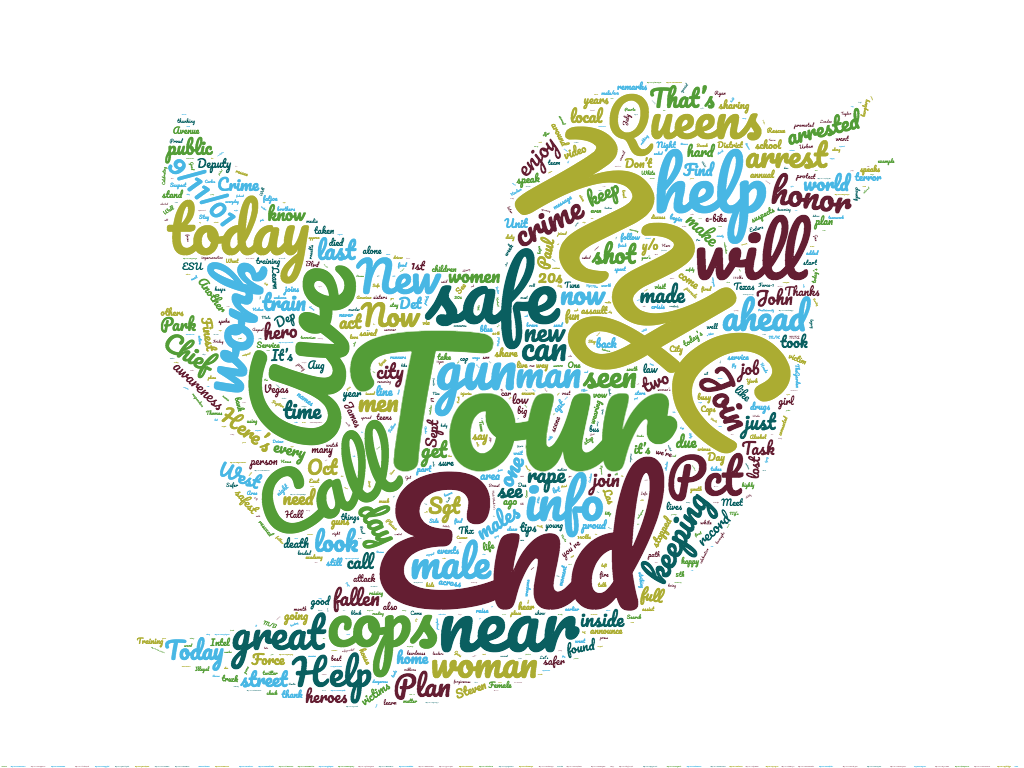
Major issue in Delhi - Traffic! Surprising?
Similarly for Twitter - observing for NYC and LV, we see most of what they post are community goodwill tweets.
How do people react to these posts?
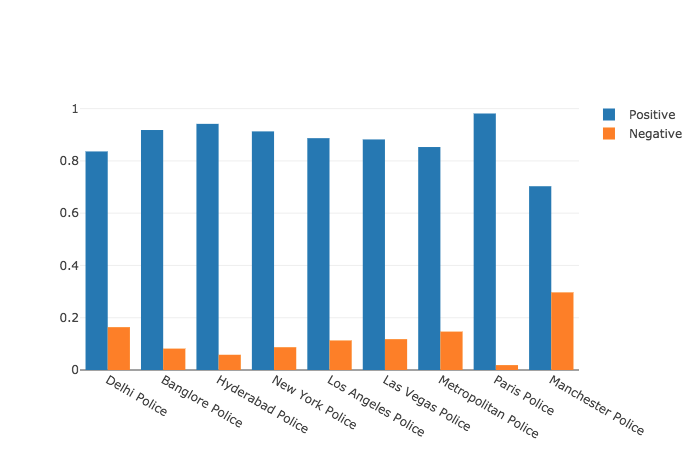
To find out if these posts generate the desired reaction from public, we collected all the replies to the Facebook posts and analysed sentiments by running them through TextBlob, The following results were obtained for different handles :
Interesting finding: The highest negative sentiments come from Manchester and Delhi Police which happen to be the cities with highest crime rates in UK and Delhi respectively. Coincidence? We don't think so!
A Deeper Content Analysis : Linguistic
For each handle, we tried to annotate all the tweets into 4 pre-decided categories, which include - Factual/Assertive, Phrases/Idioms, Factual Imperative and Imperative. We manually annotated 40% of all the tweets or 500 tweets (whichever is minimum) into these categories. With this data a classifier was built and the rest of the tweets were annotated.
Details of the classifier: The classifier used TFIDF as feature extraction technique and SVM with RBF Kernel as the classifier. K-fold (K=5) Accuracy of >80% was obtained.
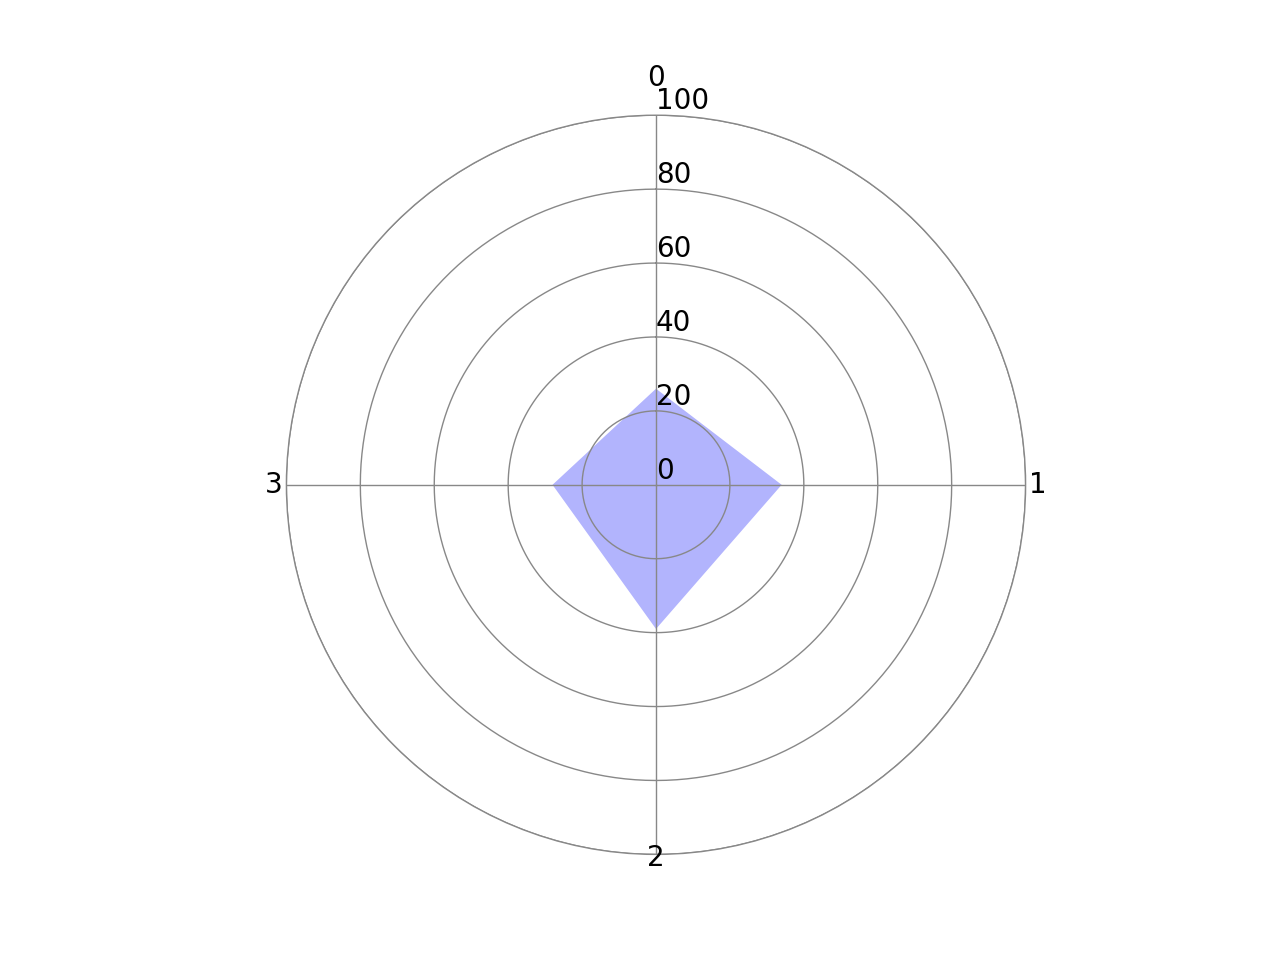
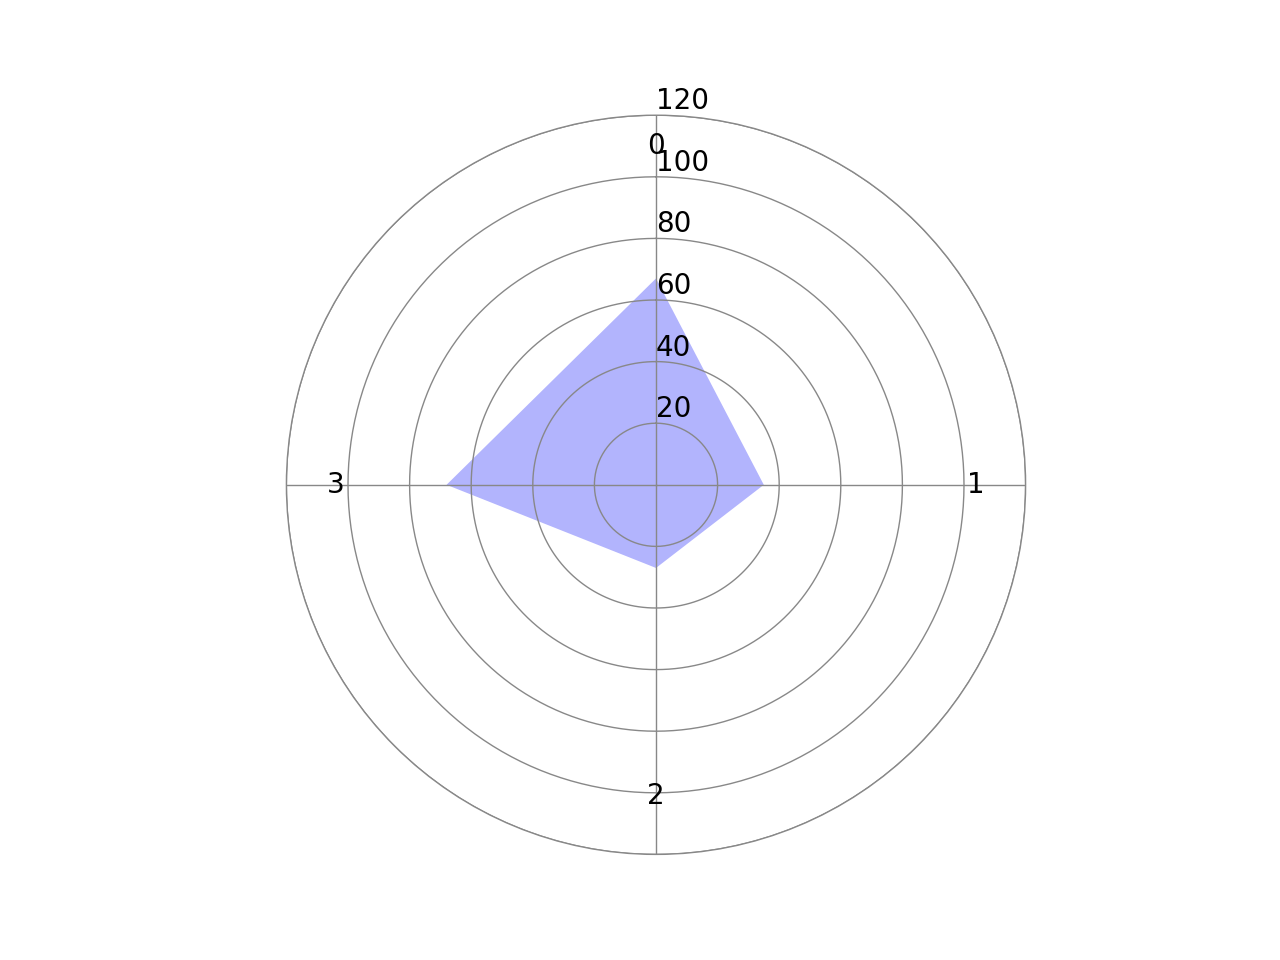
The number of tweets belonging to each class for Delhi and Los Angeles are shown below:
Los Angeles has most of its tweets in Assertive and Imperative category, while Delhi has in Phrases/Idioms and Factual Imperative category. We will see later how these affect engagement of these handles.
Physical Analysis: About which areas are people complaining about?
We analysed the tweets which were complaining about incidents occurring in various parts of the cities. This was done by passing all the tweets through Geograpy library. The plotting was done by Mapbox. This helped us identify areas with most crimes. Below is an example of NYC showing most complaints:
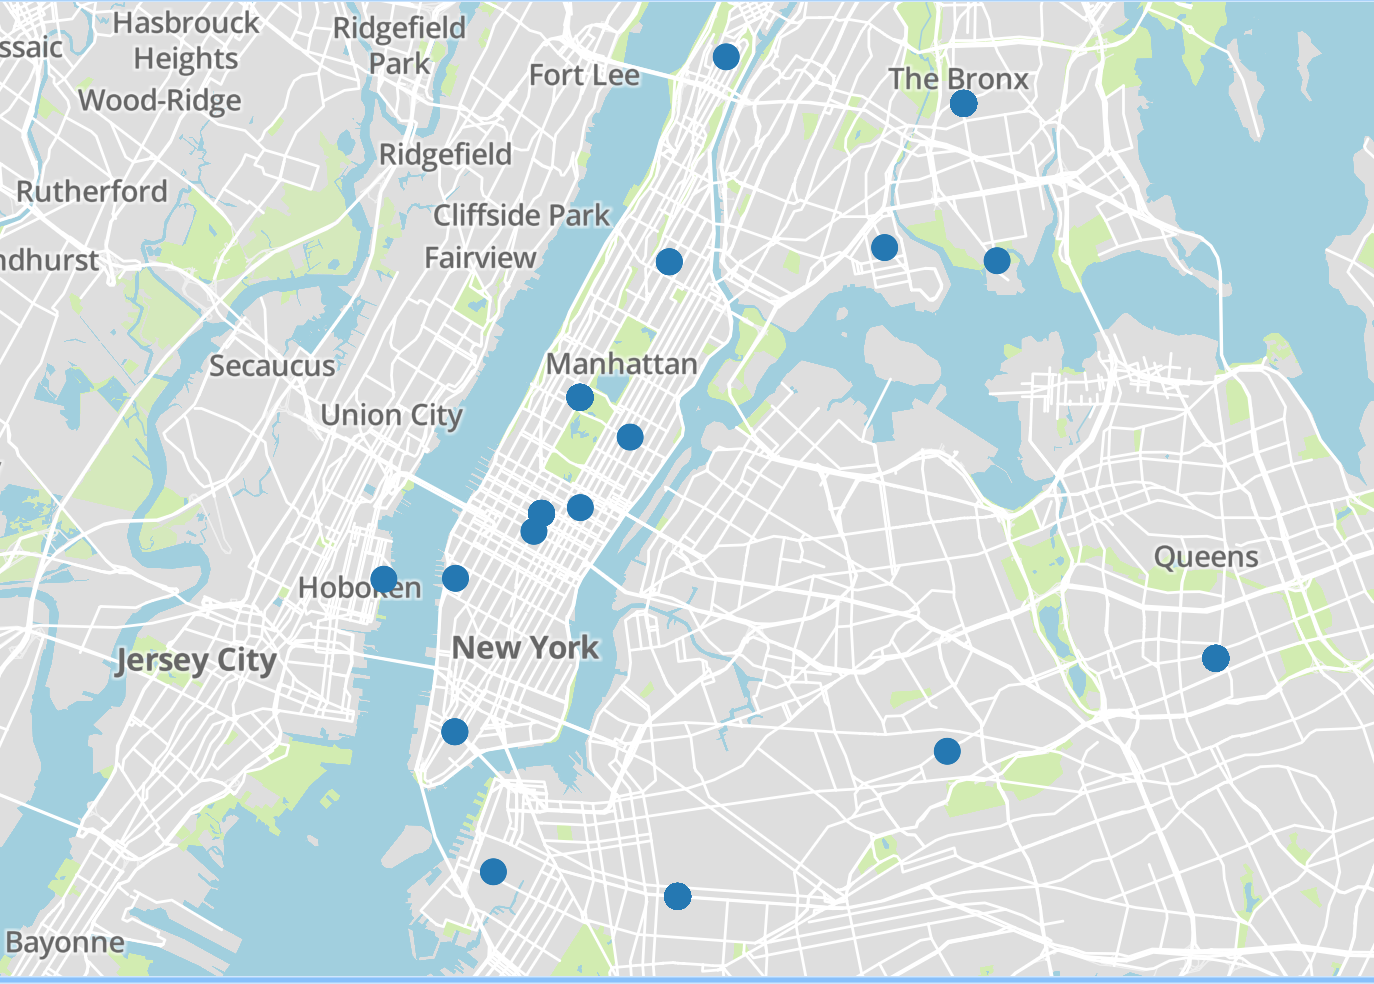
Most of the complaints come from Lower Manhattan, Bronx and Queens.
(Crime rates in areas where maximum tweets were recorded are highest locally.)
Multimedia Analysis : What do images posted by these handles contain?
All the images posted by these handles were again annotated into 5 categories - Awareness, Cases Solved, Request from Public, Functions/Awards/Felicitations and Others.
- If handle posts more Awareness related tweets:
- Main objective is not policing but information channel
- Very low community interaction
- If handle posts more Cases Solved related tweets:
- Main objective is to glorify police work
- Medium-Low community interaction
- If handle posts more Request from Public tweets:
- Main objective is to actually crowdsource data
- High Community interaction
- If handle posts more Functions/Felicitations tweets:
- Main objective is to show positive side of policing
- Medium community interaction
- If there are more of others (Selfies, Promotions, etc):
- Main objective is social harmony
- Medium-High Interaction
How did we annotate?
- Using the kaparthy/neuraltalk2 to annotate what the image is about
- Use Tensorflow to find what the image contains
- Manually correct any faults we encountered and slightly correcting them.
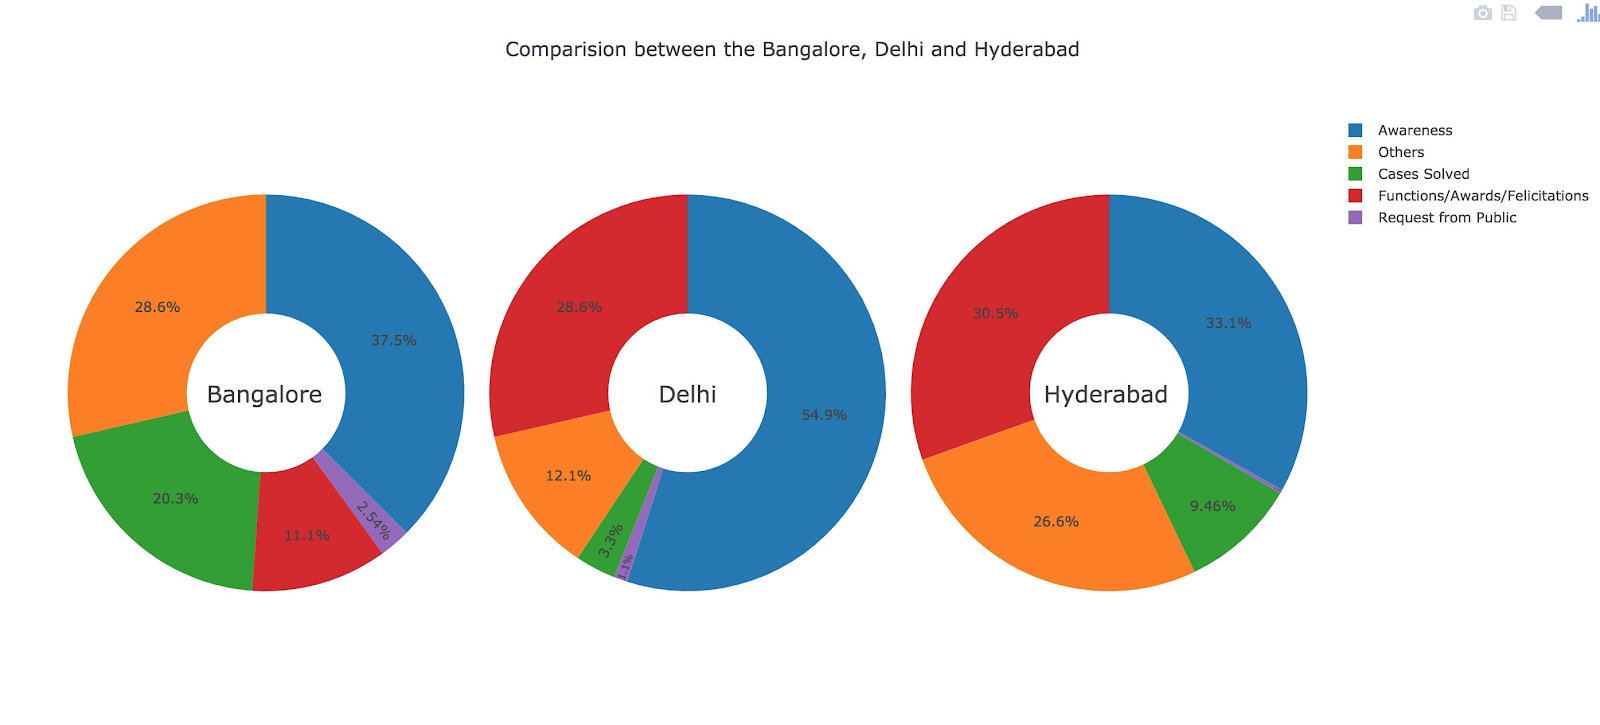
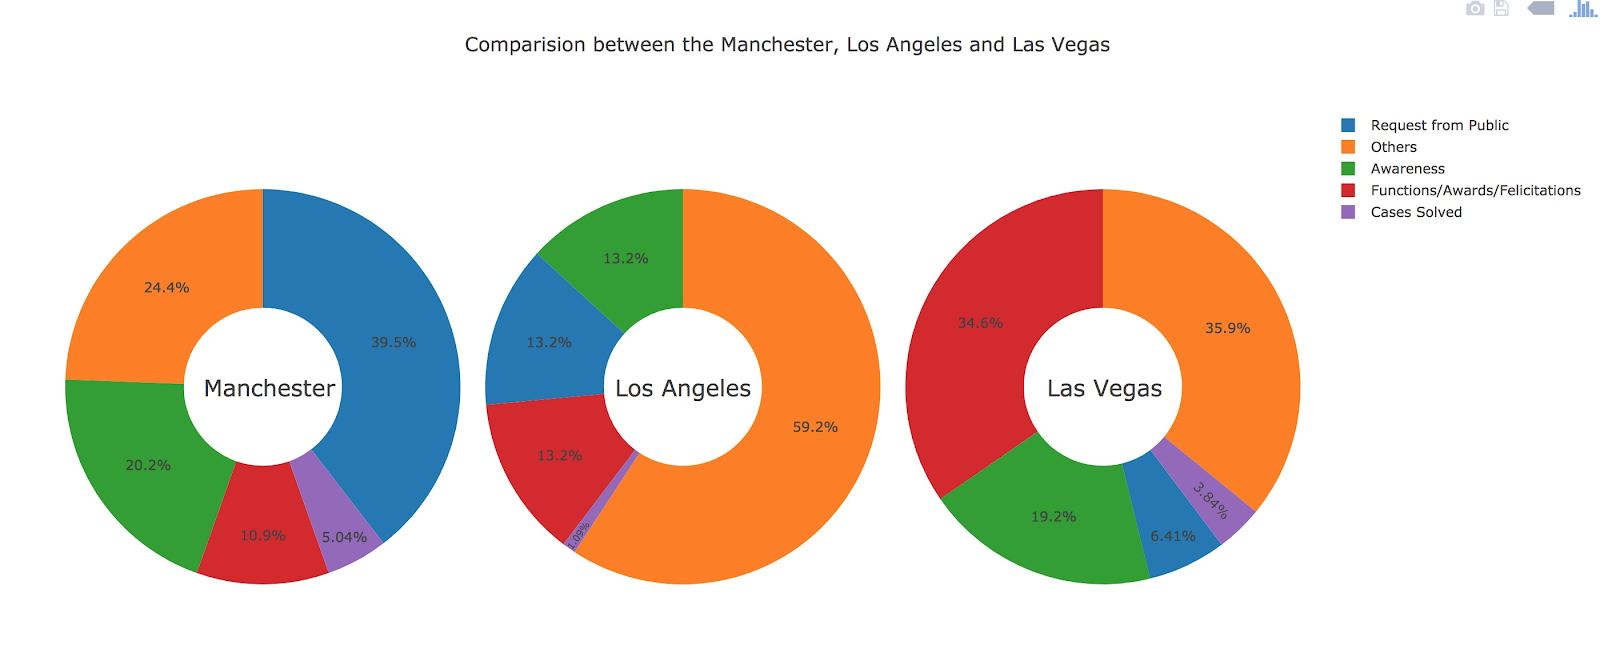
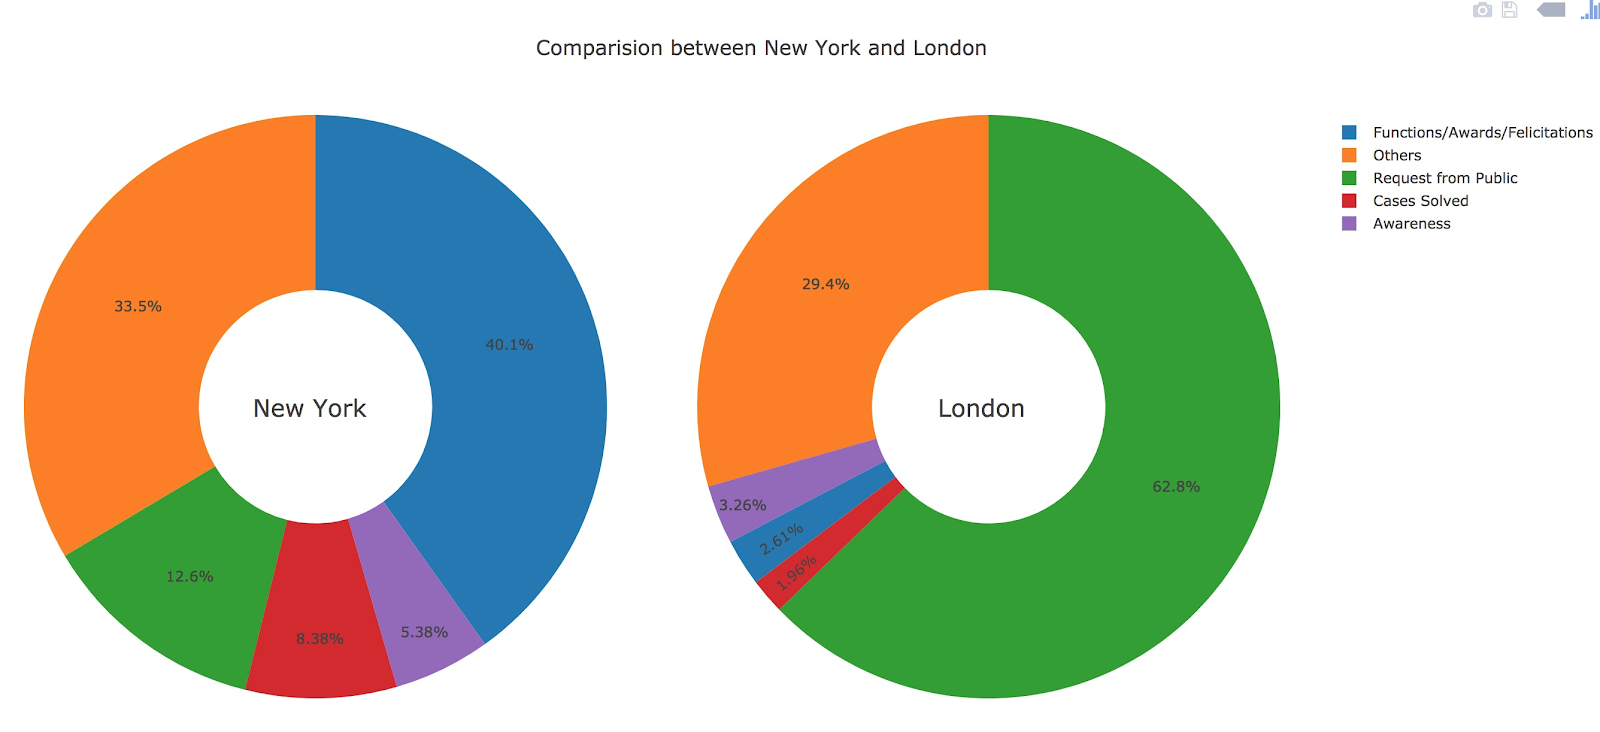
Major Findings:
- Indian cities act more of an information channel.
- New York is more interested in spreading goodwill through function pictures.
- Manchester and London Police are more interested in solving crimes through Social Media
Metrics: Engagement Rate
Engagement rate is a suitable metric incorporates all the user engagement i.e. favourites and retweets count.It also incorporates the total number of tweets. It is also normalised by followers count for each handle.
The metric is also immune to skewing and is a central tendency. This makes it robust in nature.
ER = Geometric Mean(G.M) of engagement/(total tweets*number of followers)

As it is clear form the graph, Los Angeles Police does a good job in engaging with the community.
Every police handle must strive to improve their ER.
The following graph shows the Linguistic content percentage of Tweets:

It's better to have "Police Work" component in the tweets they post.
Some Pictures from the Poster Presentation


Comments
Post a Comment